Arbitraging Prediction Markets
↓ Download Report
Overview of Prediction Markets
Prediction markets represent one of the most compelling alpha opportunities to emerge in the last decade. They are regulated exchanges where participants trade binary event contracts — instruments that pay $1 if a specified outcome occurs and $0 otherwise. The contract price at any time represents the market's implied probability of that event occurring. For instance, a contract priced at $0.65 on "Will the Fed cut rates in June?" implies the market assigns a 65% probability to that outcome.
The prediction market landscape is dominated by two platforms — Kalshi and Polymarket — that collectively control approximately 97.5% of total volume. Kalshi is more compliance-focused and operates a quote-driven orderbook where "makers" post offers and "takers" accept them. Polymarket is a crypto-native, blockchain-based prediction market.
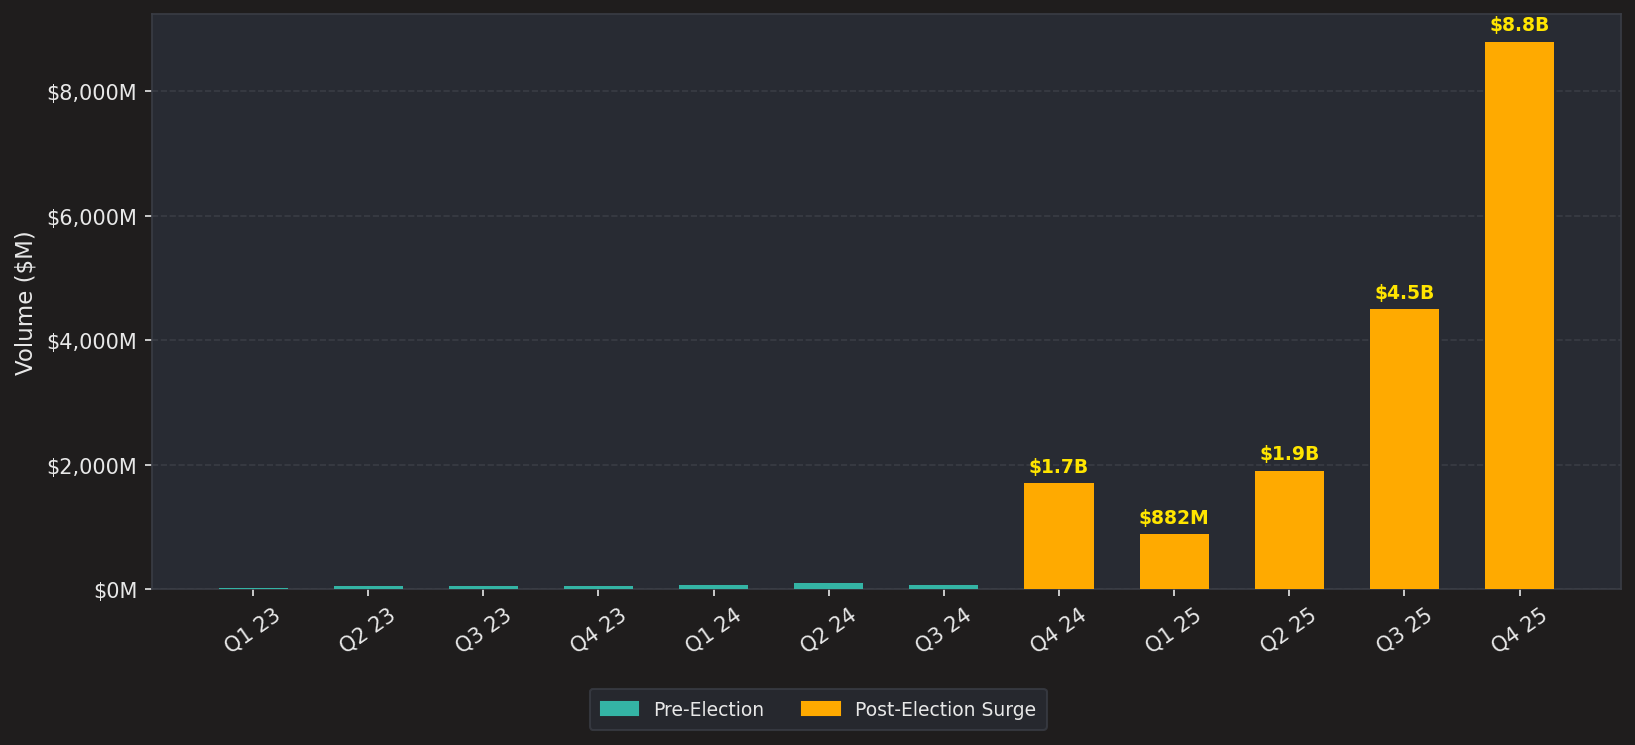
The sector's growth trajectory has been remarkable:
- Trading volume expanded from $74.4 million in Q3 2024 to approximately $9 billion in 2024, with the U.S. presidential election being its biggest driver.
- Monthly active users grew from approximately 4,000 to over 600,000 in the same timeframe.
- Polymarket raised over $250 million across multiple funding rounds.
- Kalshi secured $300 million in a funding round co-led by Andreessen Horowitz (a16z) and Sequoia Capital on October 10, 2025, reaching a $5 billion valuation.
Besides regulatory uncertainty in certain regions as a major industry risk, continued acceleration is anticipated — driven by major events including the World Cup and the World Baseball Classic.
Prediction Market Trading Volume by Quarter ($M)
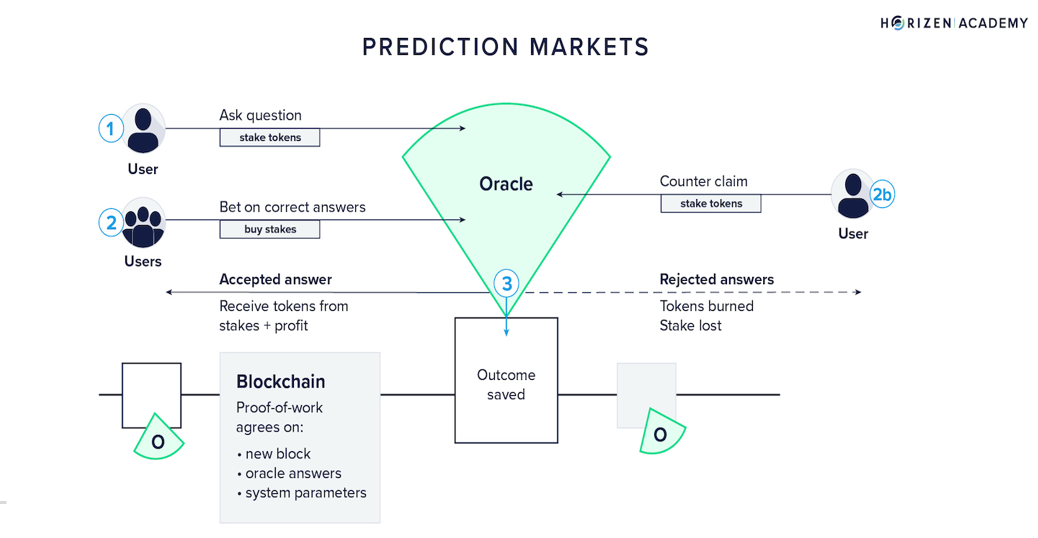
The process of how decentralised prediction markets work
Understanding the Logarithmic Market Scoring Rule (LMSR)
Polymarket primarily uses an Automated Market Maker (AMM)-based system rather than a traditional order book. Instead of waiting for a human counterparty, traders buy from and sell to a smart contract that algorithmically sets prices.
The Logarithmic Market Scoring Rule (LMSR), invented by Robin Hanson, is undoubtedly the most important algorithm in prediction markets. It is an automated market maker mechanism that determines prices based on outstanding shares.
Binary Outcome Pricing
For a market with 2 outcomes, the current price for outcome 1 is:
Where:
- is an arbitrary constant (liquidity parameter)
- is the number of outstanding shares in the outcome being priced
- is the number of outstanding shares in the other outcome
In prediction markets like Polymarket & Kalshi, and represent total shares of YES and NO bought so far. This formula is mathematically equivalent to a softmax function where the price of YES and NO sums to exactly $1.00.
Multi-Outcome Markets
Many prediction markets feature more than two mutually exclusive outcomes (e.g., "Which company will have the top-ranked AI model this year?"). In such cases:
Cost Function
The cost of executing a trade under LMSR is derived from the logarithm of the partition function:
The cost of a specific trade is the difference in the cost function before and after the trade. This ensures traders pay an amount reflecting their market impact — the more a trade pushes the price, the more expensive each additional share becomes. This is why pure arbitrage is possible but highly unscalable in small markets, leading to exploration of other alpha-seeking opportunities.
Structural Inefficiencies in Prediction Markets Create Alpha Opportunities
Despite their informational efficiency at an aggregate level, structural inefficiencies persist in prediction markets, creating a repeatable edge. Such inefficiencies are well-documented in academic literature and confirmed by proprietary analysis.
1. Favourite-Longshot Bias (FLB)
The Favourite-Longshot Bias (FLB) is the most extensively studied pricing anomaly in wagering and prediction markets. It describes the empirical pattern where:
- Contracts on unlikely outcomes ("Longshots") are systematically overpriced relative to their true probability.
- Contracts on likely outcomes ("Favourites") are systematically underpriced.
The most compelling evidence comes from Bürgi, Deng, and Whelan (2026), which uses transaction-level data on:
- 46,282 distinct contracts from 12,403 individual events
- Spanning from Kalshi's launch in 2021 through April 2025
- Over 300,000 price observations
Key findings:
- Contracts priced below $0.10 win far less often than 10% of the time; buyers of these contracts lose over 60% of their capital on average.
- Contracts priced above $0.50 win more often than their price implies.
2. Slower Incorporation of Information
Traditional financial markets incorporate new information within seconds via algorithmic trading infrastructure, co-located servers, and institutional market-making operations. Prediction markets operate in a fundamentally different regime:
- Participant base is overwhelmingly retail.
- Thinner liquidity depth slows price adjustment.
- Prices adjust to new information over a longer period rather than milliseconds.
This creates a persistent window for participants with faster information processing capabilities.
How Apeiron Effectively Captured Such Discrepancies
Our strategy deploys a systematic, quantitative framework to identify and capture mispricing across selected prediction markets.
Methodology
- Market selection: Tapping onto selected sub-markets (referred to as "Market X" for confidentiality).
- Signal generation: Algorithms identify differences between current bet prices in Market X and internally calculated probabilities derived from quantitative models.
- LLM classification: We leverage Kimi K2.5 to classify each market as
BUY_YES/BUY_NO/HOLD, alongside proprietary coded filters.
Alpha Engine
For each identified position, we calculate an edge metric defined as the spread between our fair value estimate and the prevailing market price (expressed as a percentage deviation). Positions are only initiated when this deviation exceeds a predefined consensus threshold, ensuring we act on statistically significant mispricing rather than noise.
Position Sizing
Capital deployment is governed by a Kelly Criterion sizing model, subject to:
- A fixed position cap
- A mandatory cash reserve floor
Core philosophy: Conservative — capturing small yet reliable gains on near-certain outcomes, avoiding speculative or lottery-ticket positions entirely.
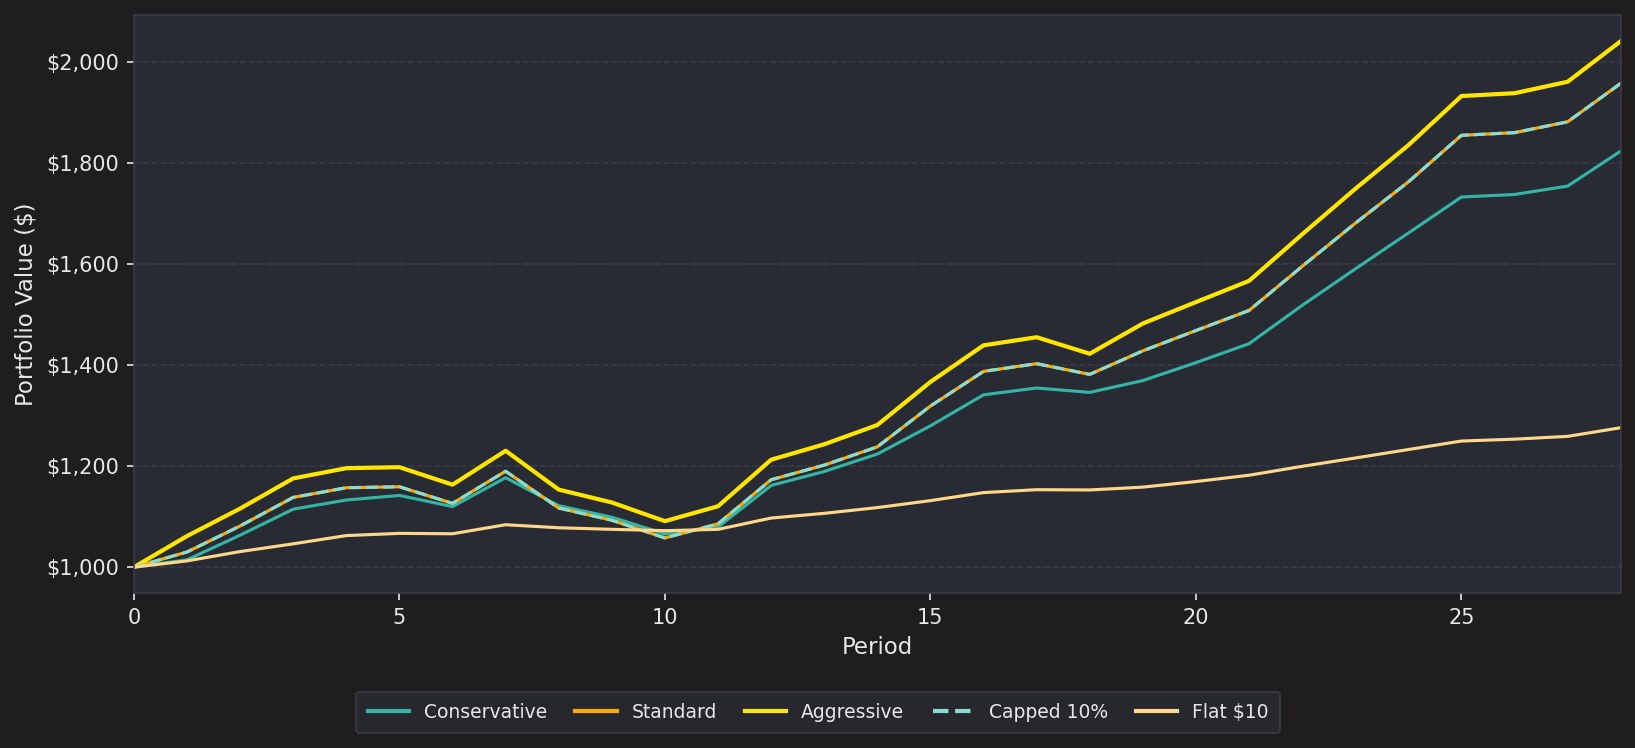
Model Performance: Simulated Portfolio Returns
Starting capital: $1,000 | Risk-free rate: 4.35%
Portfolio Value Over Time ($)
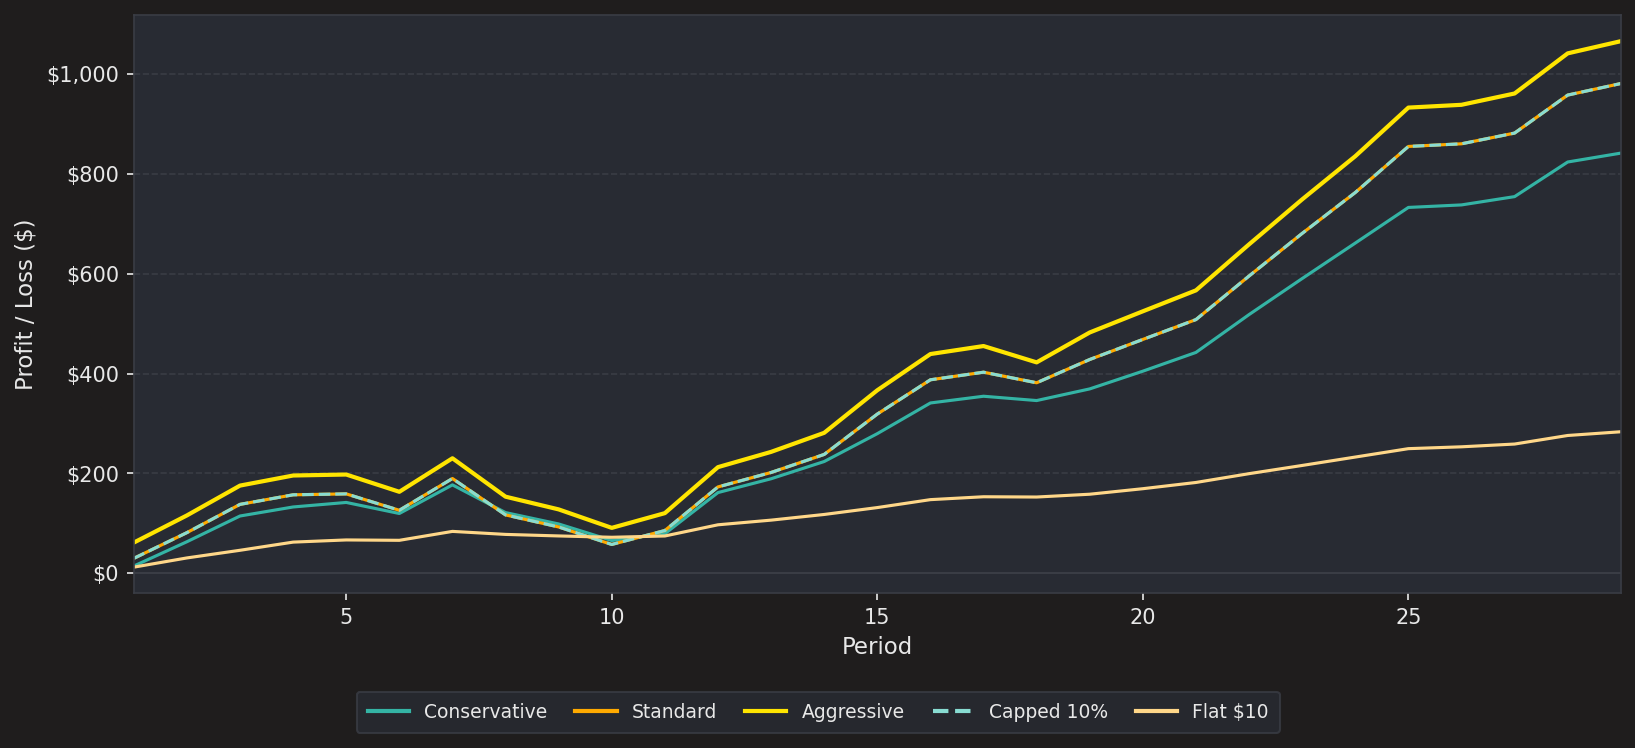
Cumulative P&L by Strategy ($)
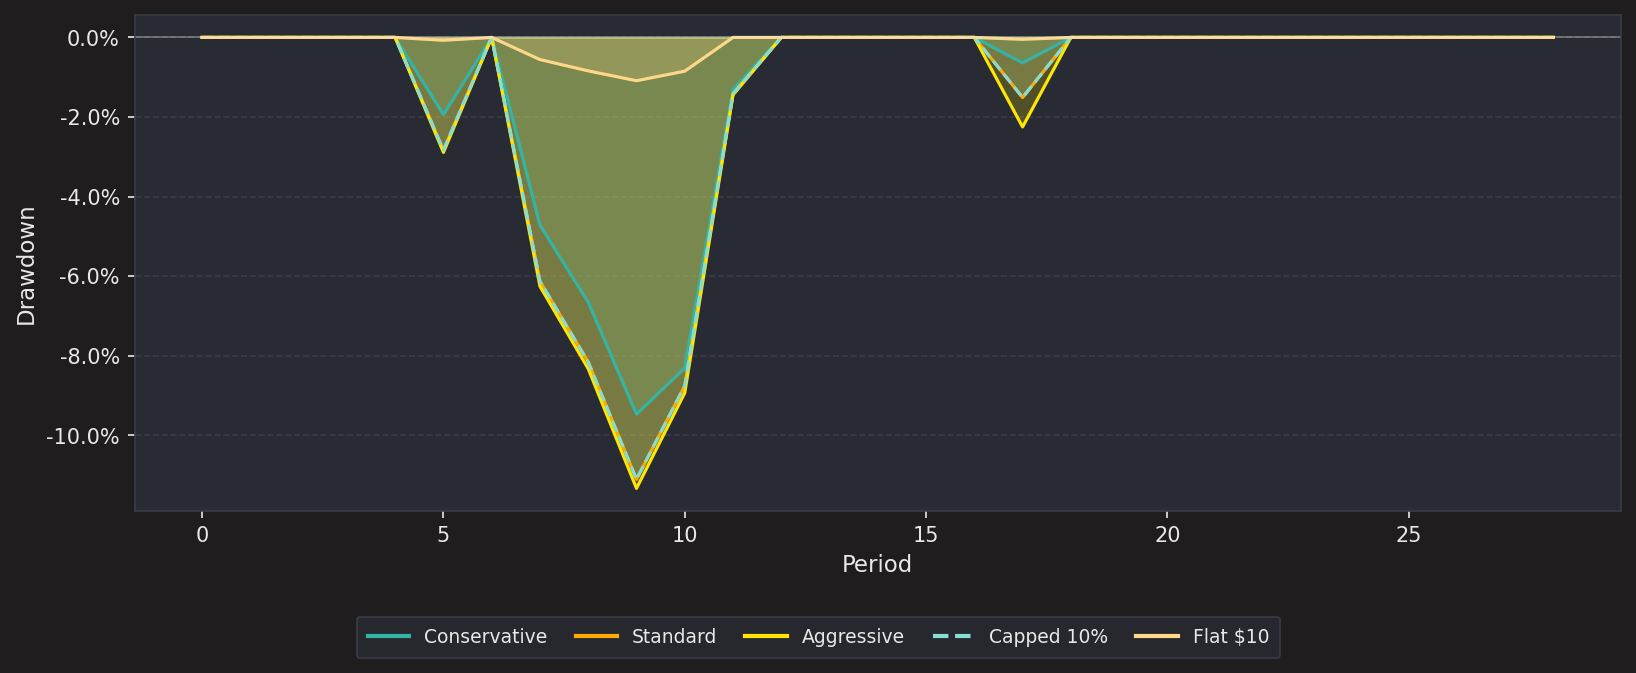
Drawdown by Strategy
Sharpe Ratios by Strategy (Daily)
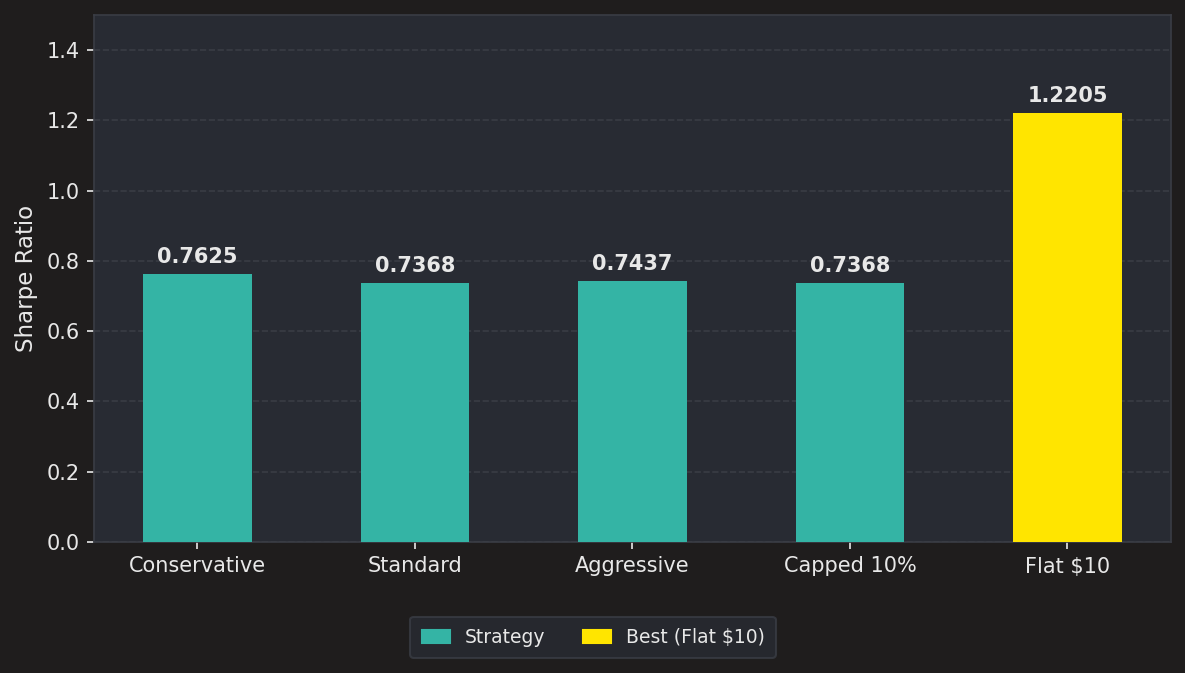
| Strategy | Sharpe Ratio (Daily) |
|---|---|
| Conservative | 0.7625 |
| Standard | 0.7368 |
| Aggressive | 0.7437 |
| Capped 10% | 0.7368 |
| Flat $10 | 1.2205 |
In summary, Apeiron has successfully built and operates a forward-looking, market-neutral alpha engine that profits from systematic inefficiencies in prediction markets, while ensuring that robust risk controls are embedded at every layer of execution.